Reports
The Reports page gives you insights into the data you record in SparkyFitness. It covers your food diary, water intake, exercise, body measurements, fasting, medications, and metrics synced from your health platform or fitness tracker. You can view this information for any date range, explore it through charts, and export it for analysis in other applications.
The Reports page is available from the top navigation bar when using SparkyFitness in a web browser.

Mobile app
The Android and iOS apps display health trends for your steps, weight, sleep, and hydration. These trends appear at the bottom of the Dashboard screen for 7-, 30-, and 90-day periods.
Web interface
The below reports are available when using SparkyFitness in a web browser.
| Report view | Information provided | Typical data source |
|---|---|---|
| Nutrients | Nutrition insights from food, water and alcohol intake | Food diary, water intake, alcohol intake |
| Measurements | Body measurements, including metrics from synced health platforms | Measurements, health sync |
| Fasting | Insights on intermittent fasting sessions | Logged fasting sessions |
| Exercise Progress | Strength, resistance and cardio workouts | Exercise entries |
| Sleep | Sleep insights | Wearable / health sync |
| Stress | Stress and mood trends | Wearable / health sync |
| Medications | Medication adherence, symptoms, and reporting for your health professionals | Medication and symptom logs |
| Table View | Raw food diary, exercise, body measurement, and custom measurement data, ready for export | Food diary, exercise entries, body measurements (including synced metrics), and custom measurement categories |
TIP
Reports always show information from the active profile. If someone has given you view reports access in Family & Friends Sharing, you can view their reports by selecting their profile from the top right corner.
Nutrients
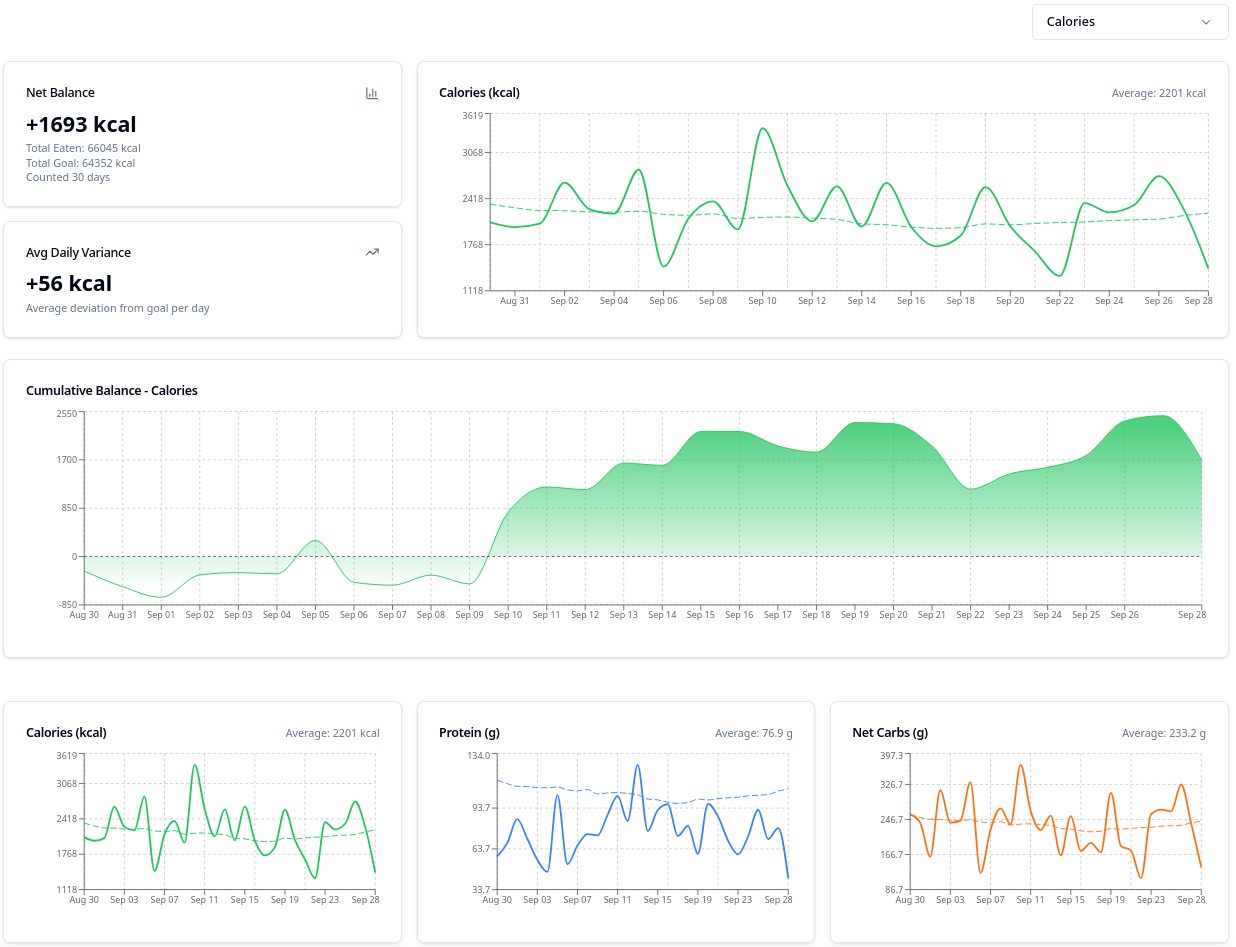
The Nutrients page shows information over the selected range:
- Weekly alcohol summary: your alcohol intake for the 7-day week containing your range's end date (aligned to your preferred first day of the week), handy for monitoring alcohol intake.
- Hydration trend: your daily Water Intake across the range, with the daily average.
- Period nutrition summary: your totals for the whole range, compared against your goals, including your overall cumulative balance. Select a measure from the drop-down box, or combine multiple.
- Nutrient charts: a grid of charts tracking individual nutrients (protein, carbs, fat, and any custom nutrients you use) across the range. Hover over the charts to see how you performed against your goals for the day.
The nutrient columns and charts you see here are controlled by Settings → Nutrient Display Settings, and the nutrients of your supplements are included in these totals, so your numbers reflect everything you actually consume.
Measurements
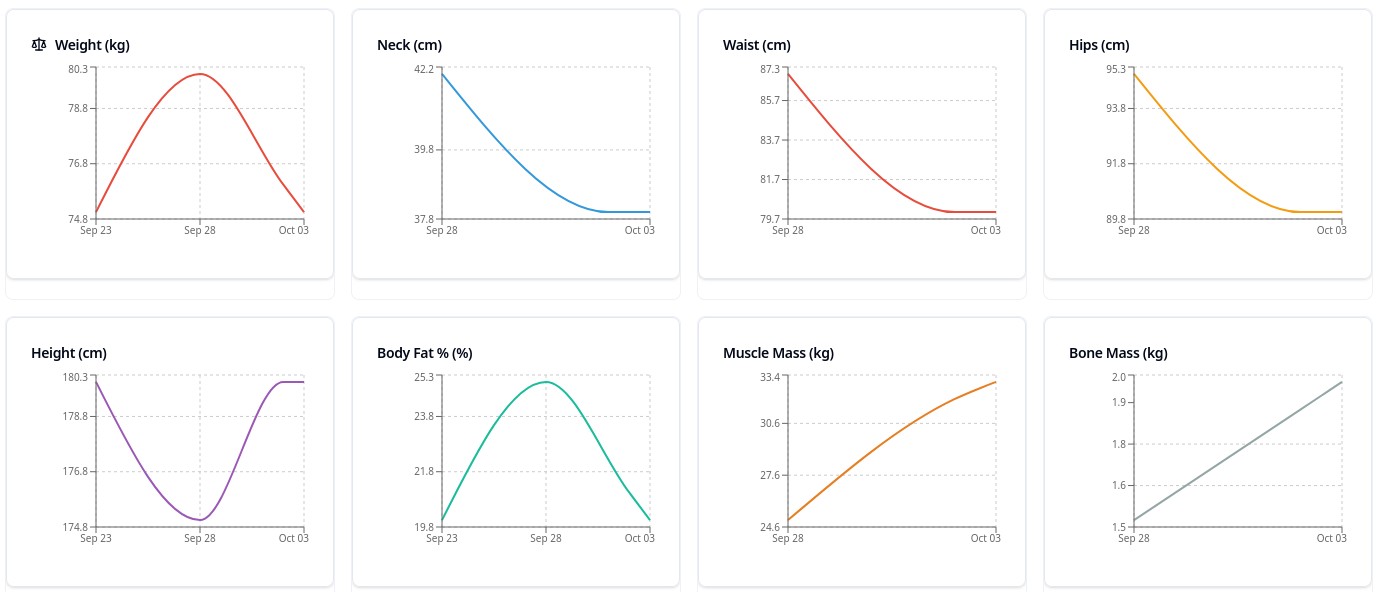
The Measurements tab shows your body measurements and synced health metrics, each in its own chart widget:
- Body measurements: all measurements including your weight, height and BMR are shown as a trend chart.
- Your custom measurement categories: every category you create in Measurements also has a trend chart.
- Health sync metrics: information provided by your health sync provider (e.g. Google Health, Apple Health, etc.) is also reported. This includes steps, distance, heart rate, blood pressure, etc.
The grid is resizable: drag widgets to rearrange or resize them, and your layout is saved, so the tab looks the same way next time you visit.
Fasting
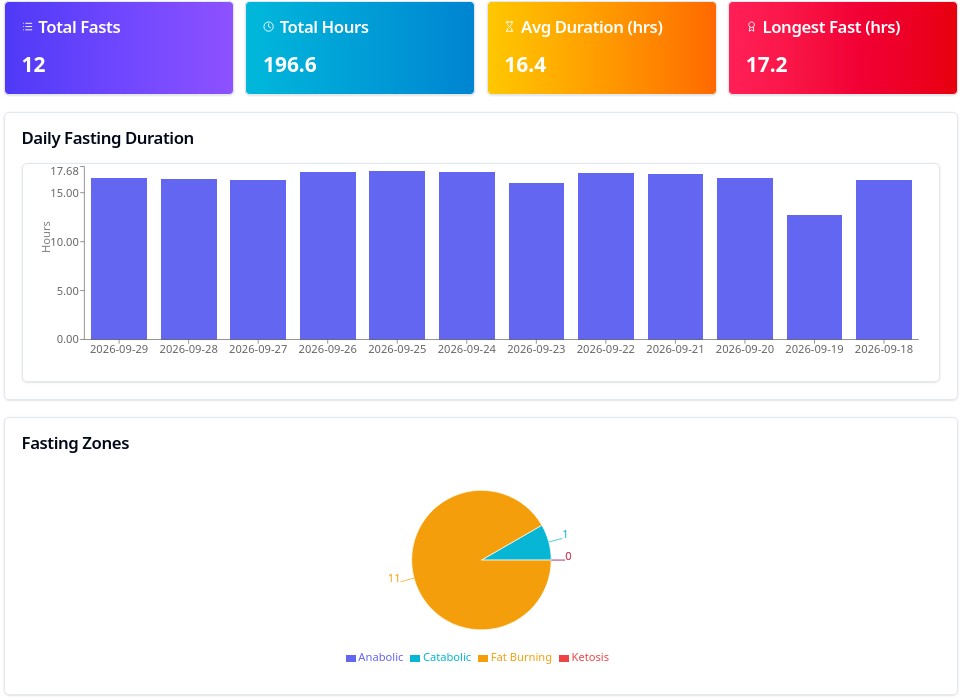
The Fasting tab turns your logged fasting sessions into a consistency report over the selected range:
- Summary cards: Total Fasts, Total Hours, Avg Duration (hrs), and Longest Fast (hrs) for the range.
- Daily Fasting Duration: a bar chart of the hours fasted per day.
- Fasting Zones: a pie chart showing how your fasts are distributed across duration zones.
- Fasting History: a table of every fast in the range with Start Date, End Date, Duration, and Protocol. A fast in progress shows Ongoing, and fasts without a named protocol show Custom.
- Fasting Heatmap (Last 90 Days): a GitHub-style grid where each square is a day and the shade of green grows with the hours fasted (under 12h, 12–16h, 16–20h, and 20h+). This is the one report that always shows the last 90 days, regardless of your selected range.
- Fasting Trends: a line chart of the 3-day moving average of daily fasting hours, which smooths out single-day noise so you can see the real trend.
Exercise
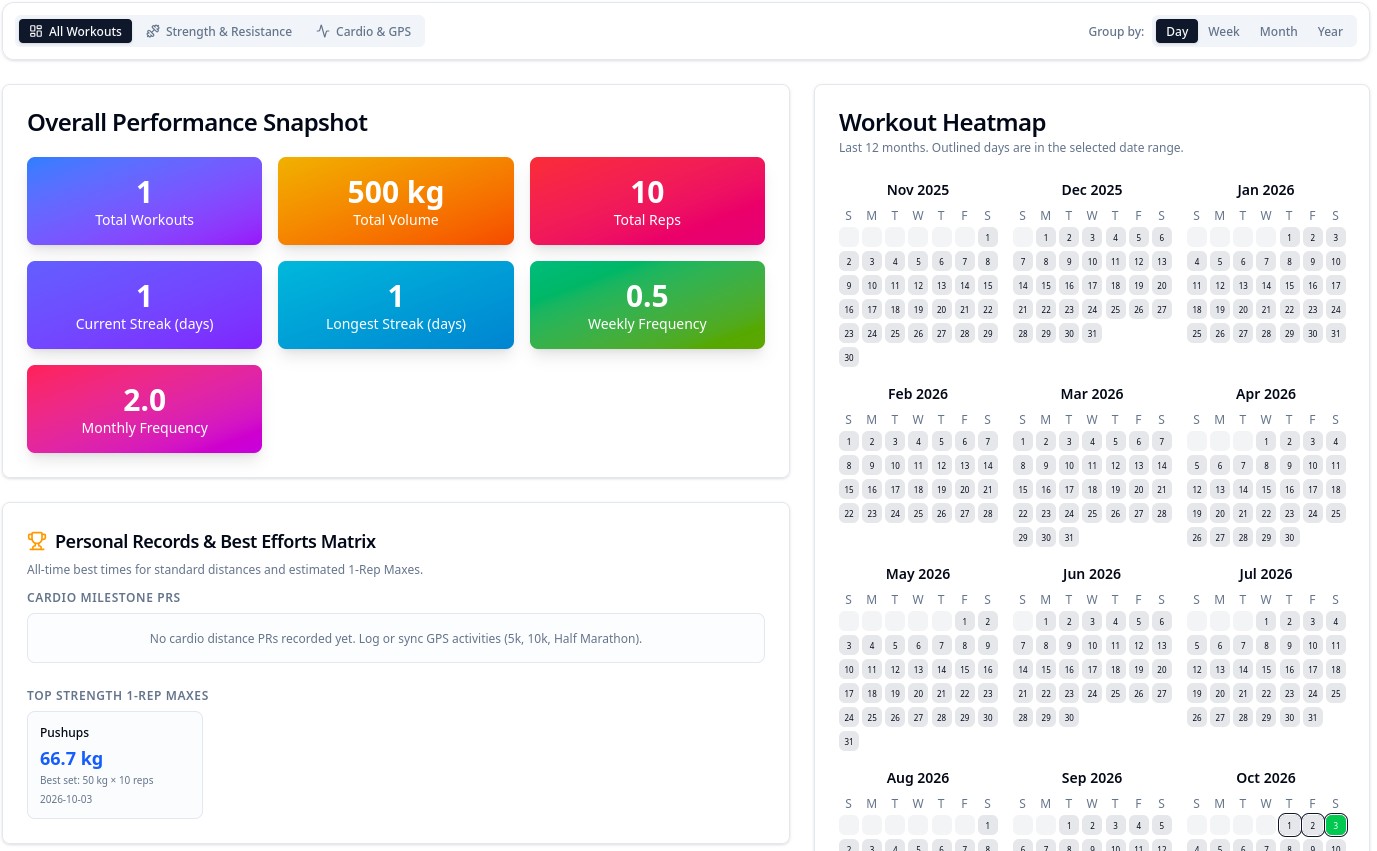
The Exercise tab analyzes your exercise entries over the range. The view switcher at the top lets you see All Workouts, just Strength & Resistance, or just Cardio & GPS, and the Group by selector aggregates data by day, week, month, or year.
The All Workouts view brings everything together: the Exercise Volume & Interval Totals chart, snapshot charts (Muscle Heat Map, Muscle Group Recovery, Exercise Variety Score, and Training Volume by Muscle Group), and the same analysis charts as the Strength & Resistance view.
Strength & Resistance charts include:
- Key stats: a summary of the headline numbers for the range.
- Volume Trend: total training volume over time.
- Max Weight Trend: how your top weights progress.
- Estimated 1RM Trend: your estimated one-rep max over time.
- Best Set by Rep Range and Reps vs Weight: how your strongest sets shift across rep ranges.
- Set Performance Analysis and Time Under Tension Trend: per-set intensity metrics.
- PR Progression and Personal Records: your bests and how they've evolved.
- Workout Heatmap: a consistency grid of your workout days.
A More analysis button expands the full set of advanced charts, and filters for equipment, muscle group, or a specific exercise apply across the dashboard — so you can watch a single lift's progression in isolation.
Cardio & GPS shows the activity sessions synced from your phone or watch: pace, cadence, heart rate (including heart-rate zones when your provider reports them), elevation, per-session stats, a lap-by-lap table, and a map of your route.
Sleep
The Sleep tab requires sleep data from your wearable or health sync — see External Providers, Google Health, COROS, or Polar. If no sleep data falls in your selected range, the tab says so instead of showing empty charts.
When data is available you get:
- Sleep charts: sleep stage breakdown (hypnogram), heart rate during sleep, respiration rate, blood oxygen (SpO2), and HRV across the range.
- Sleep History & Analytics: a table of every night in the range, with bedtime, wake time, duration, time asleep, sleep score, efficiency, sleep debt, awake periods, data source, and a plain-language insight for the night (Good Sleep, Needs Improvement, or High Debt).
- The same night from two sources counts once. If two sources record one night (for example Google Health and Health Connect both carrying a Fitbit night, or two watches), the report, the charts and sleep debt use the more detailed record: the one with sleep stages, then the one with more measures such as HRV or resting heart rate. A record that covers only part of the night never replaces the whole night, and in the report a nap from another source that doesn't overlap the night still adds to the day.
- Export to CSV: a button next to the table downloads the full history for your own analysis.
Stress
The Stress tab covers the two stress-related signals the app can track:
- Raw stress: the stress levels your wearable reports over the range. If your device doesn't report stress data, the chart shows No raw stress data available.
- Daily mood: a zoomable chart of the mood you log each day, so you can see how it moves across weeks.
Medications
The Medications tab (Medications Report — "Analyze dose correlations, side effects, and adherence trends") is built for people managing a medication regimen, with particular depth for GLP-1 therapy:
Summary cards: Average Adherence % (the percentage of scheduled doses logged as taken), GLP-1 Injections (active GLP-1 injection doses in the range), and Reported Side-Effects (the number of unique symptoms, built-in or custom, logged in the range).
Charts: use the Customize Charts button to toggle exactly which of these are shown:
- Nausea Severity vs. GLP-1 Medication Dose — your daily peak nausea (0–10) overlaid on your dose in mg.
- Weight Trend vs. Target Weight — daily weight against a target-weight line, in your preferred weight unit.
- Daily Adherence Trend (%) — dose-taking consistency per day.
- GLP-1 Daily Check-In Trends — hunger, food noise, fullness, and energy levels (0–10) tracked alongside your dose.
- Medication Log — your medications, entries, injections, and symptom entries within the range.
Symptom & side-effect correlations: four descriptive correlation cards, each with a strength badge, a confidence score, and a plain-language takeaway:
- Hydration vs. Constipation — e.g., a negative correlation reads: "Strong Hydration Benefit: Higher water intake correlates with lower constipation severity."
- Protein Intake vs. Nausea — whether nausea follows your protein intake up or down.
- Sleep Duration vs. Fatigue — whether more sleep is associated with less fatigue.
- GLP-1 Dose vs. Nausea Severity — whether your doses are tracking with your nausea.
The page is explicit that these correlations are "purely descriptive calculations over the chosen date range and do not imply clinical causality."
Sharing with your prescriber: the Prescriber-Ready Data Export card offers a Print / Save PDF Report button that produces a clean PDF summary you can hand to your doctor, plus a Download CSV Data button for the raw numbers.
Table
The Table tab gives you the raw data behind everything above:
- Table switcher: select between All, Food Diary, Exercise Entries, Body Measurements, and any custom measurement category you've created.
- Filters: the Exercise Entries table can be filtered by exercise name and by set type.
- Download (CSV): every table has a download button, so you can export your food diary, exercise entries, body measurements, or custom measurement data to use in a spreadsheet or any other tool.